


April 15, 2016 12:55 PM
Blog ★ Official Land Price
We`re very pleased with our releasing our new web page for property investments and in line with it, we`d like to start blogs which would give you a help and assistance to have a better understanding on Japan property markets for your fruitful investment portfolio.
As a first one, we`d like it to go with `Official Land Price` which would be one of the critical aspects at your reviewing property investment in Japan.
Official Land Price is published on the 1st of January every year by Land Appraisal Committee of Ministry of Land, Infrastructure, Transport and Tourism based on Public Notice of Land Prices Act., the main purposes of which are to set up a market value index for ordinary land transactions and to publish an indication of adequate land values to the markets.
Here below are the briefs on the report of the year 2016 Official Land Price from Ministry of Land, infrastructure, Transport and Tourism whose areas we`ve focused are the ones in Tokyo and in Kanagawa-ken.
Residential Land
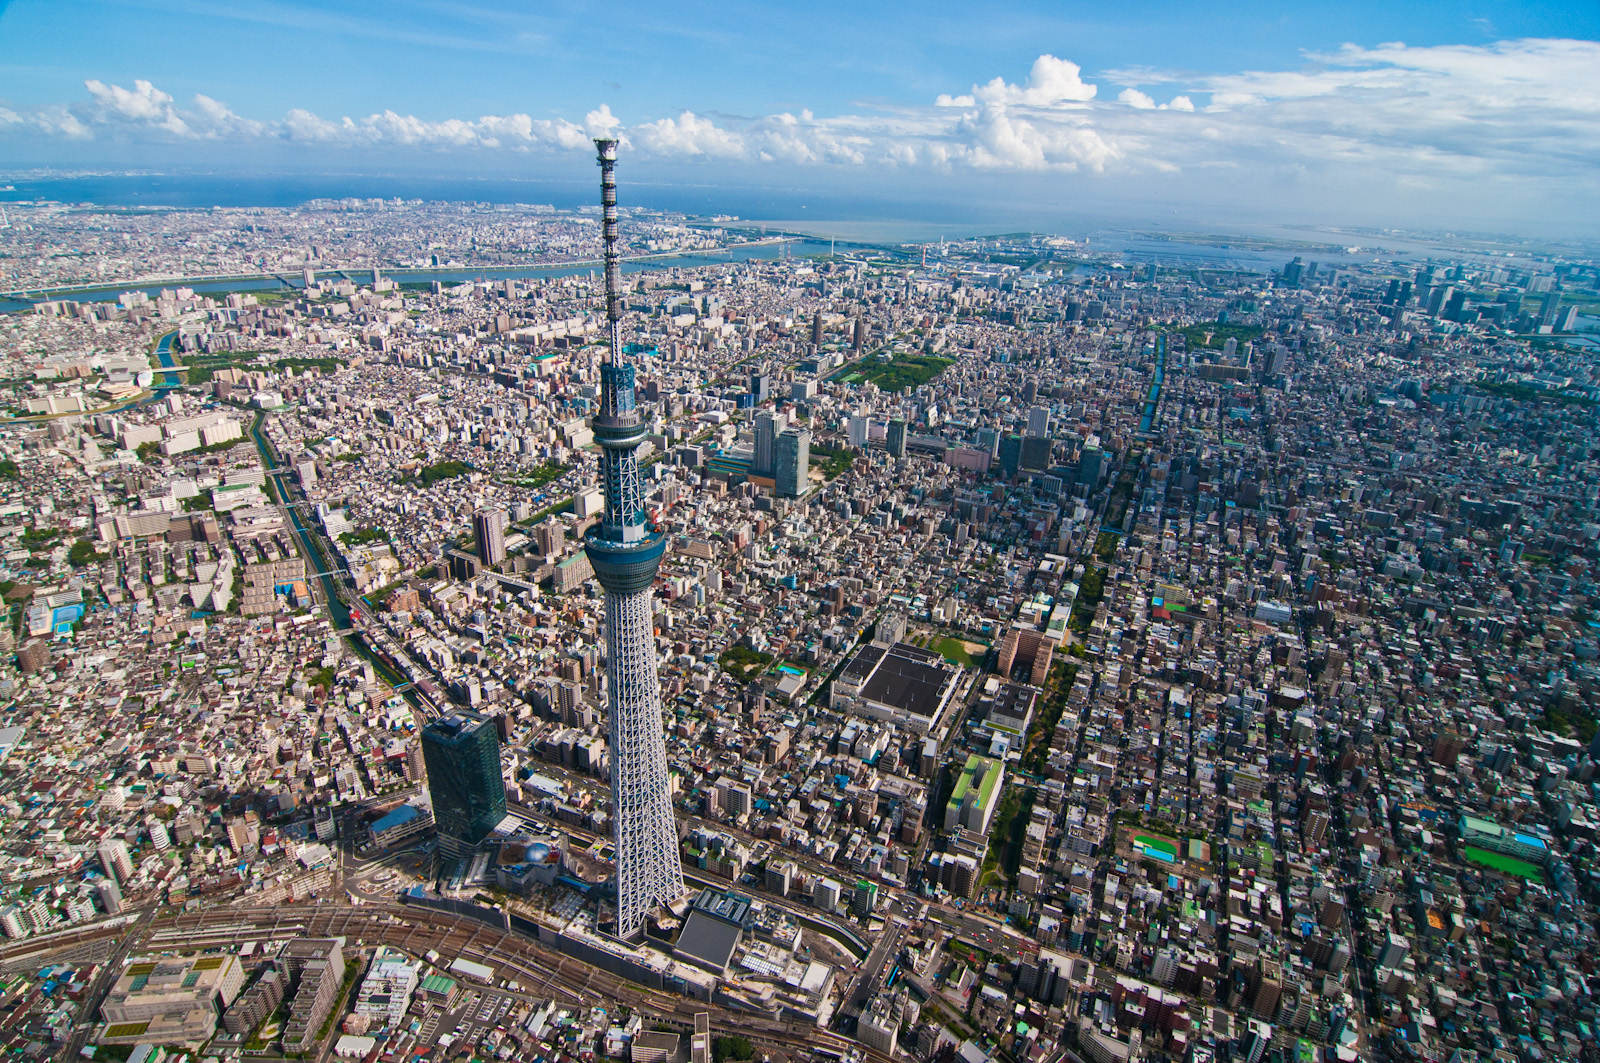
In Tokyo
○Totally 2.8% Increase in Tokyo 23 wards (1.9% increase in last year). The demand for residential lands strongly increased in the 23 wards of Tokyo as it did last year.
○Chiyoda ward - 9.4% increase (6.3% increase in last year). Chuo ward - 9.7% increase (6.4% increase in last year). Minato-ward : 6.3% increase (6.0% increase in last year).
The demand of lands for high level houses and mansions in center of Tokyo is steady but the supply is sparse which leads the high rate of increase.
○Tama Districts in total - 0.7% increase (0.8% increase in last year)
Many districts in Tama has a low rate of increase compared to that of last year, but the demands for districts like residentials in walk distance from stations of JR Chuo Line, those which has a progress in land readjustment projects and districts having large scale commercial malls continue to increase steadily except Ome-shi and Machida-shi.
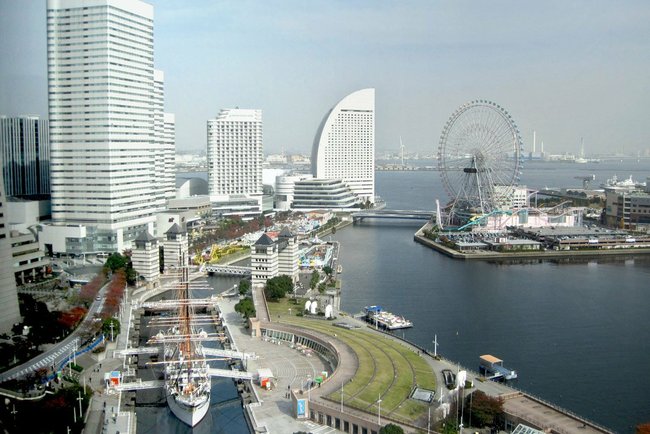
In Kanagawa-ken
○Yokohama-shi - 1.2% increase (1.5% increase last year). Kawasaki-shi - 1.1% increase (1.1% increase last year).
Yokohama-shi and Kawasaki-shi has a good access to central areas and has a steady increase in land price. Hilly areas in Yokohama-shi which located quite far from stations has a weak demand and some of which see lower rate of the increase compared to that of last year.
○Sagamihara-shi - 0.4% increase (0.3% increase last year). The areas having a good access to central Tokyo or central Yokohama has a steady increase.
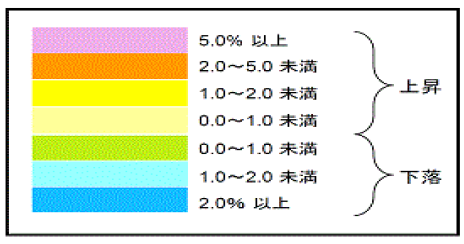
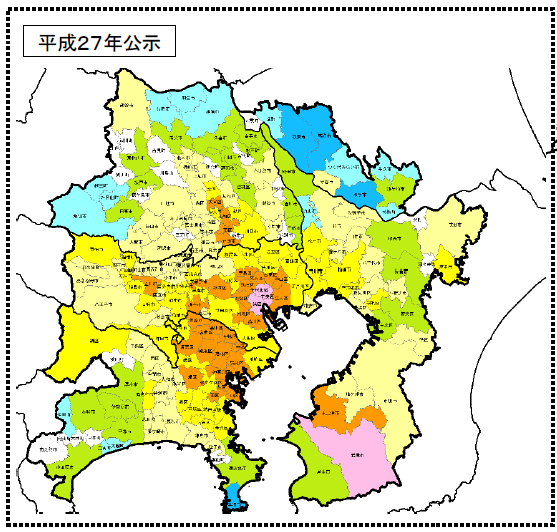
*Public Notice of 2016 (Residential)
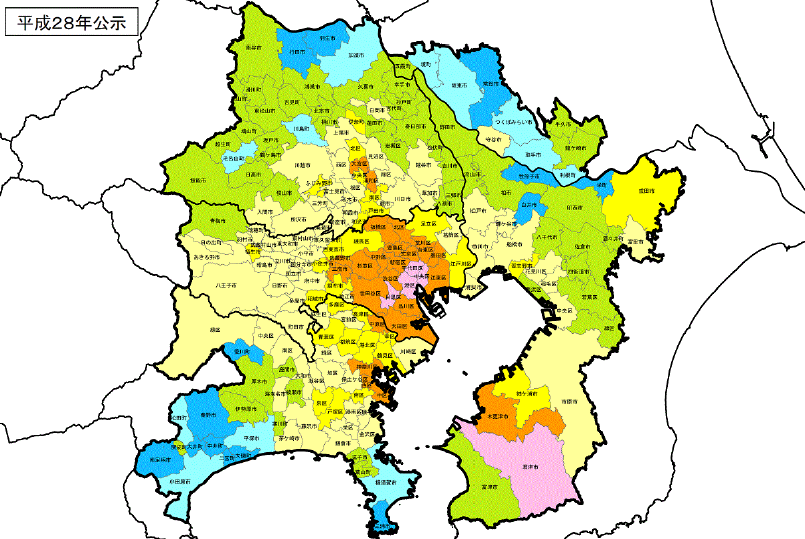

Source : Ministry of Land, Infrastructure, Transport and Tourism
*Public Notice of last year (Residential)
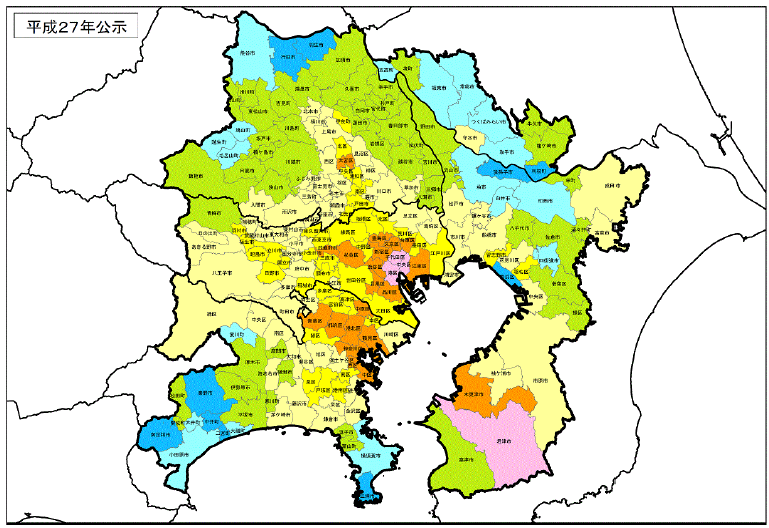
Source : Ministry of Land, Infrastructure, Transport and Tourism
Commercial Land
In Tokyo
○ Totally 4.8% Increase in Tokyo 23 wards (3.4% increase last year).
Every 23 wards has a higher rate of increase than that of last year due to the facts like outright increasing demands for larger offices by the effect of keynotes of economic recovery, large scale redevelopments in progress, increasing number of foreign tourists in-bound to Japan, and steady demand for residential land of mansion building.
・Chiyoda-ku - 7.4% increase (5.7% increase last year). Office districts like Manrunouchi and Otemachi have also a higher rate of increase than that of last year at investment porperties by the facts of outright increasing demands for larger offices, lower rate vacancy and increase of rent.
・Chuo-ku - 9.6% increase (7.2% increase last year). Ginza area has a higher rate of increase than that of last year by the facts like increasing demands for retail shops by the effect of the increasing number of foreign tourists and large scale of redevelopment.
・Minato-ku - 7.6% increase (5.6% increase last year). Toranomon and Shinbashi areas have a higher rate of increase than that of last year by the facts of constructing for a new station at Tokyo Metro Hibiya Line and large scale re-development projects.
・Shibuya-ku - 7.6% increase (4.6% increase last year). Shibuya area has a higher rate of increase than that of last year by the facts of large scale re-development projects in progress near Shibuya station, lower rate of vacancy in the offices and increasing rent, as well as increasing demand for property investments especially in Omotesando area in which many brand shops get together.
In Kanagawa-ken
○Yokohama-shi - 2.3% increase (2.4% increase last year). There is a ward where it has a lowerer rate of increase than that of last year, but all of the wards in Yokohama continue to increase due to its expectation of re-development and strong demand for residential land for mansion buildings.
・Nishi-ku - 4.5% increase (3.9% increase last year). The area at west exit of Yokohama station has a higher rate of increase than that of last year by the facts of strong demand for retail shops in busy streets and its expectation of re-development project near the station.
○Kawasaki-shi - 3.0% increase (2.8% increase last year). The commercial areas with busy streets continue to increase by the reflections of strong demand for retail properties, re-development project in progress and stable demand for residential lands of mansion buildings.
・Nakahara-ku - 4.1% increase (4.6% increase last year). It has a low rate of increase compared to that of last year, but the ward continues to increase by the facts of re-development in progress around the area of Musashikosugi station, piling up along with mansion buildings and commercial malls, and steady demands for retail shops with a good return at ROI and increasing business at indensity.
○In other districts than Yokohama-shi and Kawasaki-shi, commercial areas with busy streets continue to increase by the facts of its expectation of retail demand and steady demand for lands for mansion building near train stations. In other hands, suburban areas with not-busy streets continue to decrease by the competence with large scale commercial malls.
*Public Notice of 2016 (Commercial)
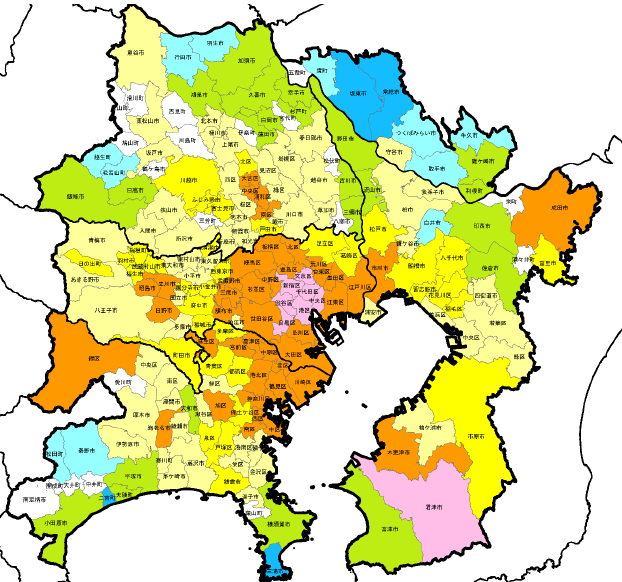
Source : Ministry of Land, Infrastructure, Transport and Tourism
*Public Notice of last year (Commercial)
Source : Ministry of Land, Infrastructure, Transport and Tourism
Official Land Price is also utilized as the standard index for ordinary land transactions and for the assessment of inheritance tax as well as Fixed Asset Tax.
As you notice after reviewing the abovementioned, we highly recommend you to take a look first at the areas classified by Official Land Price when you are on a phase deciding the location to invest in.
Hope it helps you for your fruitful investment strategy.
Recent posts
- Mori Building reveals plan for 330-meter tower in $5.5bn downtown redevelopment
- Japanese brokerages pummeled by poor retail business
- Japan real estate recovery defies demographic decline
- Tokyo condo prices tower near record heights in 2017
- Tsukiji move delay clouds Tokyo waterfront plans
- Asia's big money reigns over Japan's property market
- Buying a house in Japan can be an investment in joy
- Japan's quality bubble explains its flat-lined GDP
- SUPPLY OF NEW APARTMENTS SHRINKING AS DEVELOPERS STRUGGLE TO SECURE LAND
- Tsukiji: From fish market to food theme park
Calendar
August
| M | Tu | W | Th | F | Sa | Su |
|---|---|---|---|---|---|---|
| 1 | 2 | 3 | ||||
| 4 | 5 | 6 | 7 | 8 | 9 | 10 |
| 11 | 12 | 13 | 14 | 15 | 16 | 17 |
| 18 | 19 | 20 | 21 | 22 | 23 | 24 |
| 25 | 26 | 27 | 28 | 29 | 30 | 31 |